


Introduction
Unified Modeling Language (UML) provides a standardized way to visualize the design and architecture of software systems. Among the various UML diagrams, Component Diagrams and Deployment Diagrams are crucial for modeling the logical and physical aspects of a system, respectively. This article explores the differences between these two diagrams, their uses, and how to create them effectively using Visual Paradigm, complete with examples and practical guidance.
Component Diagrams
Definition and Purpose
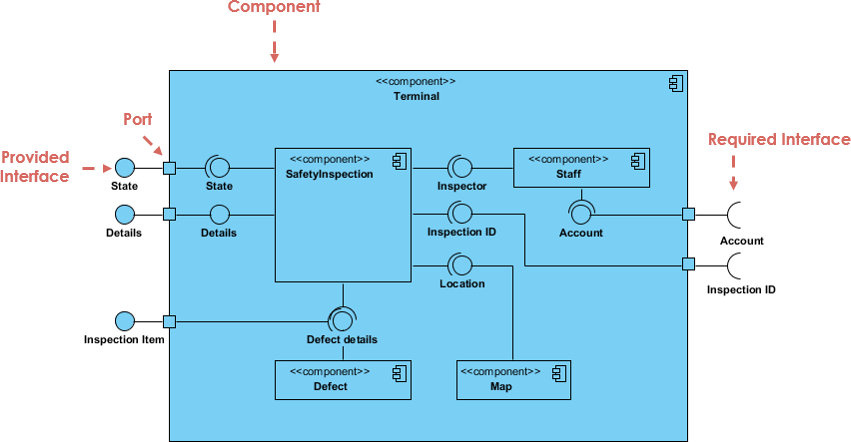
A component diagram in UML illustrates the organization and dependencies among software components. It focuses on the logical structure of the system, showing how components interact through interfaces. This diagram is particularly useful during the design phase to visualize the modular structure of a system, identify reusable components, and understand their interactions.
Key Elements
- Components: Represent modular parts of the system.
- Interfaces: Define how components interact with each other.
- Connectors: Show the relationships and dependencies between components.
Example Scenario
Consider a simple e-commerce system with the following components:
- Order Processing Component: Handles order creation and management.
- Payment Processing Component: Manages payment transactions.
- Inventory Management Component: Tracks product stock levels.
Creating a Component Diagram in Visual Paradigm
- Open Visual Paradigm: Launch the application.
- Create a New Project: Select “New Project” from the main menu.
- Add a Component Diagram: Go to
Diagram > New > Component Diagram. - Add Components: Drag and drop component shapes from the toolbar onto the canvas.
- Define Interfaces: Use interface shapes to define provided and required interfaces for each component.
- Establish Relationships: Draw connectors to represent dependencies between components.
Deployment Diagrams
Definition and Purpose
A deployment diagram in UML depicts the physical arrangement of hardware nodes and the software components deployed on them. It provides insights into system performance, scalability, and reliability by showing how software components are distributed across hardware. This diagram is essential for system architects to visualize resource allocation and identify potential bottlenecks.

Key Elements
- Nodes: Represent physical devices such as servers and workstations.
- Artifacts: Represent software components deployed on nodes.
- Associations: Indicate relationships between nodes and artifacts.
Example Scenario
Consider deploying the e-commerce system components on physical servers:
- Web Server: Hosts the Order Processing Component.
- Application Server: Hosts the Payment Processing Component.
- Database Server: Hosts the Inventory Management Component.
Creating a Deployment Diagram in Visual Paradigm
- Open Visual Paradigm: Launch the application.
- Create a New Project: Select “New Project” from the main menu.
- Add a Deployment Diagram: Navigate to
Diagram > New > Deployment Diagram. - Add Nodes: Drag node shapes onto the canvas to represent physical devices.
- Add Artifacts: Use artifact shapes to represent software components deployed on each node.
- Define Associations: Use association lines to indicate relationships between nodes and artifacts.
Component vs Deployment Diagram
In the context of the software development process, UML Component Diagrams and Deployment Diagrams play distinct yet interconnected roles. They represent different stages and perspectives of the system’s architecture and deployment, contributing to a comprehensive understanding of both the logical and physical aspects of the system. Here’s a discussion on their relationship within the software development lifecycle:
-
Component Diagrams (Logical Design):
- Early Stage: Component diagrams are typically created during the early stages of the software development process, particularly during the design phase. They focus on the logical organization of the system by identifying the key components and their interactions.
- Modularity and Reusability: These diagrams help in defining the system’s modular structure, which is crucial for maintaining and scaling the software. By identifying reusable components, developers can promote code reuse and reduce redundancy.
- Interface Definition: Component diagrams emphasize the interfaces between components, which is essential for ensuring that different parts of the system can communicate effectively.
-
Deployment Diagrams (Physical Deployment):
- Later Stage: Deployment diagrams come into play later in the development process, often during the deployment and implementation phases. They focus on how the software components are physically distributed across hardware nodes.
- Resource Allocation: These diagrams are crucial for understanding how resources are allocated and utilized. They help in identifying potential bottlenecks and ensuring that the system is scalable and performant.
- System Topology: Deployment diagrams provide a clear view of the system’s topology, which is essential for network configuration, security planning, and maintenance.
Summary
| Aspect | Component Diagram | Deployment Diagram |
|---|---|---|
| Purpose | Represents the high-level structure of software components | Models the physical deployment of software components |
| Focus | Logical organization and relationships of components | Physical deployment on hardware nodes |
| Main Elements | Components, interfaces, connectors | Nodes (hardware), artifacts (software), associations |
| Use Cases | Used for designing and organizing software architecture | Used for understanding system topology and resource allocation |
Interdependence and Iterative Development
-
Iterative Refinement: Although component diagrams are typically created first, the development process is iterative. As the system evolves, both component and deployment diagrams may need to be refined. Changes in the logical design (component diagram) can impact the physical deployment (deployment diagram) and vice versa.
-
Feedback Loop: The deployment diagram can provide feedback to the component diagram. For instance, if certain components are found to be resource-intensive during deployment, it might necessitate revisiting the component design to optimize performance.
-
Collaboration: Both diagrams facilitate collaboration among different stakeholders. Component diagrams are often used by developers and architects to discuss the system’s structure, while deployment diagrams are used by system administrators and DevOps teams to plan and manage the deployment environment.
Example of Relationship
Consider an e-commerce application:
-
Component Diagram: Defines components like
OrderProcessing,PaymentProcessing, andInventoryManagement. It shows how these components interact through interfaces. -
Deployment Diagram: Shows how these components are deployed on physical servers. For example,
OrderProcessingmight be deployed on a web server,PaymentProcessingon an application server, andInventoryManagementon a database server.
Conclusion
Component and deployment diagrams serve distinct yet complementary roles in UML modeling. Component diagrams help in designing the logical structure of software systems, while deployment diagrams provide insights into the physical deployment of these systems. By using Visual Paradigm, you can effectively create and manage both types of diagrams, ensuring comprehensive coverage of both logical and physical aspects of system design. This approach facilitates better communication among stakeholders and more efficient project execution.
In the software development process, component diagrams and deployment diagrams are interconnected, each serving a unique purpose but contributing to a holistic view of the system. Component diagrams focus on the logical design, ensuring that the system is modular and maintainable, while deployment diagrams address the physical deployment, ensuring that the system is efficiently distributed across hardware resources. By iteratively refining both diagrams, developers can create robust, scalable, and efficient software systems.
References
- Stack Overflow: Differences of Component Diagrams and Deployment Diagrams
- Comprehensive Tutorial on Deployment Diagrams with Visual Paradigm
- Visual Paradigm: Component Diagram vs. Deployment Diagram in UML
- Visual Paradigm User Guide: Drawing Deployment Diagrams
- YouTube: UML Component and Deployment Diagrams
- Visual Paradigm Learning: Deployment Diagram
- Modern Analyst: End-to-End UML Component and Deployment Diagram
- Visual Paradigm: What is a Deployment Diagram?
This article provides a comprehensive overview of UML component and deployment diagrams, complete with examples and guidance on using Visual Paradigm to create them effectively.