


DFDs are used across various stages of system development, from initial requirements gathering to detailed design and even in system documentation. They help stakeholders, including developers, analysts, and end-users, to gain a clear understanding of how data is processed and transformed within the system. By visualizing these interactions, DFDs facilitate better communication, identify potential bottlenecks or inefficiencies, and ensure that the system meets its functional requirements.
This tutorial aims to provide a comprehensive guide to understanding and creating Data Flow Diagrams. We will delve into the key concepts that underpin DFDs, explore the relationships among their components, and offer practical tips and guidelines to help you create effective and insightful diagrams. Whether you are new to DFDs or seeking to refine your skills, this tutorial will equip you with the knowledge and techniques necessary to leverage DFDs effectively in your projects.
DFD Element Notation
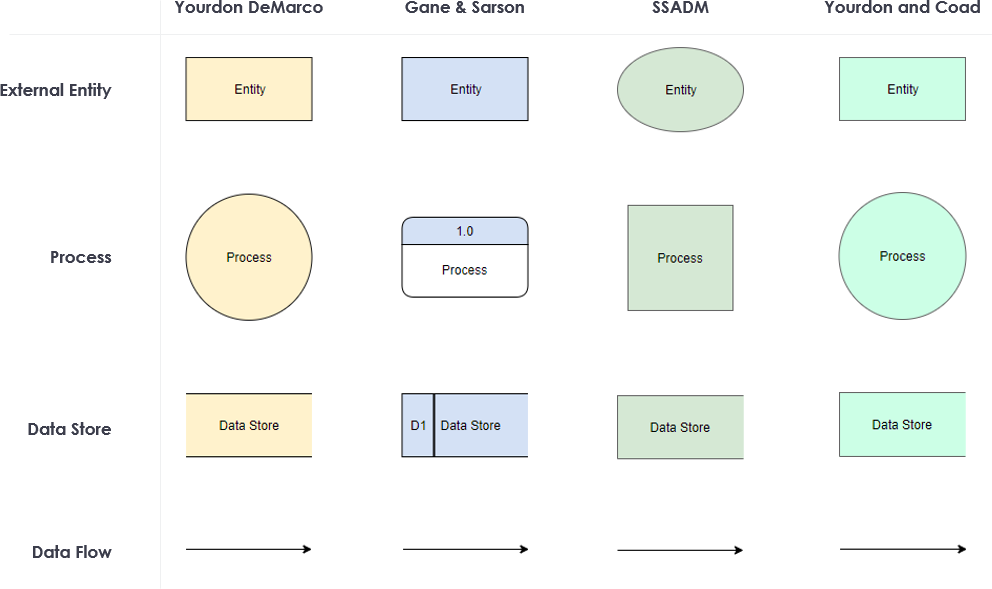
Data Flow Diagrams (DFDs) use various notations to represent different elements within a system. The image you provided illustrates four different notations for DFD elements: Yourdon DeMarco, Gane & Sarson, SSADM, and Yourdon and Coad. Let’s explore each notation and its representation of external entities, processes, data stores, and data flows:
1. Yourdon DeMarco Notation
- External Entity: Represented as a rectangular box with the label “Entity.” It signifies sources or destinations of data outside the system’s control.
- Process: Depicted as a circle labeled “Process.” It represents operations or transformations performed on data within the system.
- Data Store: Shown as an open-ended rectangle labeled “Data Store.” It represents locations where data is stored and can be accessed by processes.
- Data Flow: Illustrated as arrows indicating the direction of data movement between entities, processes, and data stores.
2. Gane & Sarson Notation
- External Entity: Displayed as a rectangular box labeled “Entity,” similar to Yourdon DeMarco.
- Process: Represented as a rounded rectangle with the label “Process” and a number (e.g., 1.0) indicating the process level or sequence.
- Data Store: Shown as an open-ended rectangle with a vertical line on the left side, labeled “Data Store.” The vertical line may include a reference number (e.g., D1).
- Data Flow: Depicted as arrows showing the direction of data flow between elements.
3. SSADM (Structured Systems Analysis and Design Methodology) Notation
- External Entity: Illustrated as an oval labeled “Entity,” distinguishing it from other notations.
- Process: Shown as a rounded rectangle labeled “Process,” similar to Gane & Sarson but without additional numbering.
- Data Store: Represented as a rectangle labeled “Data Store,” without the vertical line seen in Gane & Sarson.
- Data Flow: Indicated by arrows showing the direction of data movement.
4. Yourdon and Coad Notation
- External Entity: Depicted as a rectangular box labeled “Entity,” similar to Yourdon DeMarco and Gane & Sarson.
- Process: Shown as a circle labeled “Process,” similar to Yourdon DeMarco.
- Data Store: Represented as an open-ended rectangle labeled “Data Store,” similar to Yourdon DeMarco.
- Data Flow: Illustrated as arrows indicating the direction of data flow between elements.
Key Differences
- Shape and Labeling: Each notation uses distinct shapes and labeling conventions for external entities, processes, and data stores.
- Process Representation: Gane & Sarson and SSADM use rounded rectangles for processes, while Yourdon DeMarco and Yourdon and Coad use circles.
- Data Store Representation: Gane & Sarson includes a vertical line with a reference number, while other notations use simple rectangles.
Understanding these notations allows analysts and designers to choose the one that best fits their project’s needs and preferences, ensuring clear and effective communication of system design.
Key Concepts
1. External Entity
External entities are sources or destinations of data that interact with the system but are outside its control. They can be users, other systems, or external databases.
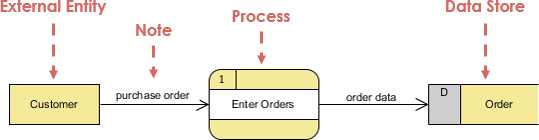
- Example: In the provided images, “Customer” and “Broker” are external entities.
2. Process
A process transforms incoming data into outgoing data. It represents an operation or a set of operations performed on the data.
- Example: The “Enter Orders” process takes “purchase order” as input and produces “order data” as output.
3. Data Store
A data store holds data that can be accessed and modified by processes. It represents a storage location where data is kept for future use.
- Example: The “Order” data store holds order details that can be retrieved or updated by processes.
4. Data Flow
Data flows represent the movement of data between external entities, processes, and data stores. They are depicted as arrows showing the direction of data movement.
- Example: The arrow from “Customer” to “Enter Orders” represents the flow of the “purchase order” from the customer to the process.
Relationships Among DFD Components
External Entity to Process
- Interaction: External entities provide input data to processes or receive output data from them.
- Example: The “Customer” provides a “purchase order” to the “Enter Orders” process.
Process to Data Store
- Interaction: Processes read from or write to data stores.
- Example: The “Enter Orders” process writes “order data” to the “Order” data store.
Data Store to Process
- Interaction: Data stores provide data to processes when needed.
- Example: The “Order” data store provides order details to processes that require them.
Process to External Entity
- Interaction: Processes send output data to external entities.
- Example: The “Enter Orders” process sends order confirmation to the “Customer.”
Top-Down Decomposition
This diagram represents a more detailed data flow diagram (DFD) for an order processing system, specifically focusing on the interaction between a customer, a broker, and the order placement process. Here’s a breakdown of the components and their interactions:

-
External Entities:
- Customer: This entity initiates the process by placing an order.
- Broker: This entity acts as an intermediary in the order process, receiving transaction details from the customer and forwarding order details to the system.
-
Processes:
- Place Order (Online): This process handles orders placed online by customers. It receives order details directly from the customer.
- Transaction Details: This process manages transaction details, receiving input from the customer and forwarding it to the broker.
- Place Order (Phone): This process handles orders placed via phone. It receives order details from the broker.
-
Data Stores:
- Order Details: This data store holds the details of orders placed through the online process.
- Transaction Details: This data store holds transaction details that are processed and forwarded to the broker.
-
Data Flows:
- Order Details (Customer to Place Order Online): This data flow represents the order information provided by the customer when placing an order online.
- Transaction Details (Customer to Transaction Details): This data flow represents transaction information provided by the customer.
- Transaction Details (Transaction Details to Broker): This data flow represents transaction information being forwarded to the broker.
- Order Details (Broker to Place Order Phone): This data flow represents order information provided by the broker when placing an order via phone.
-
Process Numbers:
- 0, 1, 2: These numbers likely indicate the sequence or identification of processes within the system. Process 0 seems to be a central process that interacts with both online and phone order processes.
Interpretation
- The diagram illustrates a system where orders can be placed either online or via phone.
- Online orders are directly processed by the “Place Order (Online)” process, which stores order details.
- For phone orders, the process involves a broker who receives transaction details from the customer and forwards order details to the “Place Order (Phone)” process.
- The broker acts as an intermediary, facilitating the transaction and order placement process for phone orders.
- The focus is on capturing and managing order and transaction details, ensuring they are correctly processed and stored regardless of the order method (online or phone).
This DFD provides a more detailed view of the order processing system, highlighting the roles of different entities and processes in handling orders and transactions.
Tips and Tricks
- Start Simple: Begin with a context-level DFD to get an overview of the system and gradually move to more detailed levels.
- Consistency: Use consistent naming conventions for processes, data stores, and data flows to avoid confusion.
- Clarity: Ensure that data flows are clearly labeled and arrows are directed correctly to show the flow of data.
- Modularity: Break down complex processes into smaller, manageable sub-processes for better clarity and understanding.
- Validation: Regularly validate the DFD with stakeholders to ensure it accurately represents the system’s data flow.
Guidelines
- Identify Boundaries: Clearly define the system boundaries to distinguish between internal processes and external entities.
- Focus on Data: Emphasize the flow of data rather than the control flow or sequence of operations.
- Level of Detail: Start with a high-level DFD (Level 0) and progressively refine it into more detailed levels (Level 1, Level 2, etc.).
- Use Standard Symbols: Adhere to standard symbols for processes, data stores, external entities, and data flows to maintain clarity and consistency.
- Document Assumptions: Document any assumptions or constraints related to the DFD to provide context and avoid misunderstandings.
Conclusion
Data Flow Diagrams are more than just visual aids; they are essential tools for anyone involved in system analysis and design. By providing a clear and structured way to represent data flow, DFDs help bridge the gap between abstract system requirements and concrete implementation details. They enable stakeholders to visualize how data is handled within a system, identify areas for improvement, and ensure that the system’s design aligns with its intended functionality.
Throughout this tutorial, we have explored the fundamental concepts of DFDs, including external entities, processes, data stores, and data flows. We have examined how these components interact and provided practical tips and guidelines for creating effective DFDs. By mastering these concepts and techniques, you can create DFDs that not only accurately represent your system’s data flow but also serve as valuable communication tools throughout the development lifecycle.
As you continue to work with DFDs, remember that clarity, consistency, and attention to detail are key. Regularly validate your diagrams with stakeholders, and don’t hesitate to iterate and refine them as your understanding of the system evolves. With practice and a solid foundation in DFD principles, you will be well-equipped to tackle even the most complex system analysis challenges. Embrace the power of Data Flow Diagrams, and unlock new levels of insight and efficiency in your system design endeavors.