 and Top-Down Decomposition")
Introduction to Data Flow Diagrams (DFD)
Data Flow Diagrams (DFDs) are graphical representations used to illustrate the flow of data within a system. They are essential tools in software engineering and system analysis, helping to visualize how data is processed, stored, and transferred between different components of a system. DFDs are particularly useful for understanding the system’s functionality, identifying potential issues, and communicating system design to stakeholders.
Key Concepts of DFD
-
Processes: Represented by circles or rounded rectangles, processes are activities or operations that transform data in some way. Each process takes input data, processes it, and produces output data.
-
Data Stores: Depicted as open-ended rectangles, data stores hold data that can be accessed and modified by processes. They represent databases, files, or other storage mechanisms.
-
External Entities: Shown as rectangles, external entities are sources or destinations of data that are outside the system’s control. They interact with the system by providing input data or receiving output data.
-
Data Flows: Illustrated as arrows, data flows represent the movement of data between processes, data stores, and external entities. They show the direction of data transfer.
-
Leveling: DFDs are typically drawn at different levels of abstraction, with each level providing more detail about the system. The top level (Level 0) provides a context diagram, while subsequent levels (Level 1, Level 2, etc.) decompose processes into more detailed sub-processes.
Top-Down Decomposition in DFD
Top-down decomposition is a method of breaking down a complex system into smaller, more manageable components. In the context of DFDs, this involves starting with a high-level view of the system (context diagram) and progressively decomposing each process into more detailed sub-processes. This approach helps in understanding the system’s functionality at various levels of granularity.
 and Top-Down Decomposition")
Steps in Top-Down Decomposition
-
Context Diagram (Level 0):
- The context diagram provides a high-level overview of the system, showing the system as a single process and its interactions with external entities.
- It defines the system boundaries and identifies the main inputs and outputs.
-
Level 1 DFD:
- The Level 1 DFD decomposes the single process from the context diagram into several sub-processes.
- Each sub-process represents a major function or activity within the system.
- Data stores and data flows between sub-processes are identified.
-
Level 2 DFD and Beyond:
- Further decomposition occurs at Level 2, where each sub-process from Level 1 is broken down into more detailed sub-processes.
- This process continues until the desired level of detail is achieved.
- Each level provides a more detailed view of the system’s functionality.
Balancing DFD Levels
Balancing ensures that the data flows and stores are consistent across different levels of DFDs. This involves verifying that the inputs and outputs of processes at one level match the data flows and stores at the next level. Balancing helps maintain the integrity and accuracy of the system’s representation.
Example Based on the Image
The image illustrates the top-down decomposition of a system using DFDs:
- Level 0 (Context): Shows the system as a single process interacting with external entities.
- Level 1: Decomposes the system into several sub-processes, each representing a major function. Data stores and data flows between sub-processes are identified.
- Level 2: Further decomposes each sub-process from Level 1 into more detailed sub-processes, providing a deeper understanding of the system’s functionality.
DFD Example
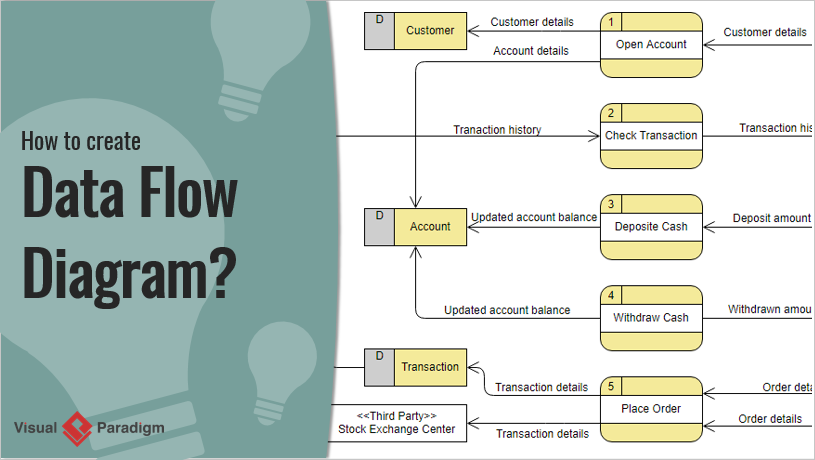
The Data Flow Diagram (DFD) depicts a Securities Trading Platform, created using Visual Paradigm. This DFD illustrates the flow of data within the system, highlighting the interactions between various processes, data stores, and external entities. Here’s a detailed explanation and interpretation of the diagram:
Components of the DFD
-
External Entities:
- Customer: Represents the users of the trading platform who interact with the system to perform actions like opening accounts, depositing cash, and withdrawing cash.
- Customer Service Assistant: An entity that assists customers, likely involved in account opening processes.
- Broker: An external entity that interacts with the system to place orders on behalf of customers.
- Third Party Stock Exchange Center: Represents external stock exchange centers that provide transaction details.
-
Processes:
- 1. Open Account: This process involves creating a new account for the customer. It receives customer details from both the customer and the customer service assistant and stores account details.
- 2. Check Transaction: This process verifies transaction history, likely for validation or auditing purposes.
- 3. Deposit Cash: Allows customers to deposit money into their accounts, updating the account balance in the data store.
- 4. Withdraw Cash: Enables customers to withdraw money from their accounts, also updating the account balance.
- 5. Place Order: Facilitates the placement of orders by brokers, using order details and transaction details from external entities.
-
Data Stores:
- Customer: Stores customer-related information.
- Account: Contains details about customer accounts, including balances and transaction histories.
- Transaction: Holds records of transactions, which are essential for tracking and auditing purposes.
-
Data Flows:
- Arrows indicate the direction of data flow between processes, data stores, and external entities. For example, customer details flow from the customer to the “Open Account” process, and transaction details flow from the “Third Party Stock Exchange Center” to the “Place Order” process.
Interpretation
- Customer Interaction: Customers interact with the system to open accounts, deposit or withdraw cash, and these actions update their account balances and transaction histories.
- Broker Role: Brokers place orders using the system, relying on transaction details from external stock exchange centers.
- Data Integrity: The system maintains data integrity by updating data stores with each transaction, ensuring that account balances and transaction histories are accurate.
- Assistance: Customer service assistants support the account opening process, indicating a need for human intervention or support in certain processes.
Conclusion
Data Flow Diagrams (DFDs) and top-down decomposition are powerful tools for analyzing and designing systems. By breaking down complex systems into smaller, more manageable components, DFDs help in understanding the system’s functionality, identifying potential issues, and communicating system design to stakeholders. The key to effective DFDs lies in balancing the levels and ensuring consistency in data flows and stores across different levels of abstraction.
The DFD example provides a clear visualization of how data flows within a securities trading platform, highlighting key processes and interactions with external entities. It is a useful tool for understanding the system’s functionality, identifying potential areas for improvement, and communicating the system design to stakeholders.
DFD References
-
Visual Paradigm Data Flow Diagrams – Stack Overflow
- Discusses the availability of Data Flow Diagrams in different editions of Visual Paradigm, including the need for the Modeler Edition or higher to create DFDs.
- Read more on Stack Overflow
-
Online Data Flow Diagram Maker
- An online tool for creating Data Flow Diagrams quickly and efficiently, with features for sharing diagrams in various formats.
- Explore the Online DFD Maker
-
A Step-by-Step Guide to Creating Data Flow Diagrams with Visual Paradigm
- Provides a detailed guide on creating DFDs using Visual Paradigm, including drag-and-drop functionality for external entities and processes.
- Access the Step-by-Step Guide
-
Data Flow Diagram Tool – Visual Paradigm
- Highlights the features of Visual Paradigm’s DFD tool, including the ability to decompose processes and maintain model integrity across different levels.
- Learn about the DFD Tool
-
What is Data Flow Diagram?
- Explains the structure and purpose of DFDs, emphasizing their role in visualizing data flow within a system.
- Understand Data Flow Diagrams
-
Data flow diagram in Visual Paradigm
- Offers a chapter on creating DFDs with Visual Paradigm, including supported notations and process decomposition techniques.
- Read the Data Flow Diagram Chapter
-
How to Draw Data Flow Diagram (DFD)?
- Provides instructions on drawing DFDs, including how to decompose processes and manage data flows between different levels.
- Learn How to Draw DFDs
-
Mastering Data Flow Diagrams with Visual Paradigm: A Step-by-Step Guide
- A comprehensive guide on mastering DFDs using Visual Paradigm, with practical examples and templates.
- Access the Mastering DFD Guide
-
Data Flow Diagram Templates
- Offers free online DFD templates and examples to help users create professional diagrams.
- Explore DFD Templates
-
How to Create Data Flow Diagram (DFD)?
- A tutorial on creating DFDs, including steps for selecting templates and adding details to diagrams.
- Follow the DFD Creation Tutorial
These references provide a solid foundation for understanding and creating Data Flow Diagrams using Visual Paradigm, with resources ranging from basic guides to advanced tutorials.