


A UML Package Diagram is a structural diagram that organizes model elements into packages, illustrating how these packages depend on each other. Visual Paradigm provides a robust platform for creating and managing package diagrams effectively. This comprehensive guide will walk you through the process of creating a UML Package Diagram using Visual Paradigm, complete with detailed examples and references.
Key Concepts of Package Diagrams
1. Package
A package is a mechanism for grouping UML elements. It is represented by a folder icon with a tab containing the package name. Packages help in organizing and managing large models by grouping related elements together.
Example:
- Package Name:
CustomerManagement - Contents: Classes like
Customer,Order,Invoice
2. Dependency
A dependency indicates that one package relies on another. It is represented by a dashed arrow pointing from the dependent package to the independent package.
Example:
- Dependent Package:
OrderProcessing - Independent Package:
CustomerManagement - Dependency:
OrderProcessingdepends onCustomerManagement
3. Import
An import is a special type of dependency that allows one package to access the contents of another. It is shown with an «import» stereotype.
Example:
- Importing Package:
Billing - Imported Package:
CustomerManagement - Import:
BillingimportsCustomerManagement
4. Merge
A merge indicates that the contents of one package are merged with another. It is represented by a dashed arrow with a «merge» stereotype.
Example:
- Merging Package:
CustomerManagement - Merged Package:
CustomerFeedback - Merge:
CustomerManagementmerges withCustomerFeedback
5. Generalization
A generalization shows that one package is a specialized version of another. It is represented by a solid arrow with a hollow triangle.
Example:
- Specialized Package:
PremiumCustomerManagement - General Package:
CustomerManagement - Generalization:
PremiumCustomerManagementis a specialized version ofCustomerManagement
Steps to Create a Package Diagram in Visual Paradigm
1. Create a New Project
- Open Visual Paradigm.
- Click on “File” > “New” > “Project”.
- Name your project (e.g.,
EcommerceSystem) and click “OK”.
2. Create a Package Diagram
- In the Project Browser, right-click on your project and select “New Diagram” > “Package Diagram”.
- Name your diagram (e.g.,
EcommercePackageDiagram) and click “OK”.
3. Add Packages
- In the Diagram Toolbar, click on the “Package” icon.
- Click on the diagram area to place a package.
- Double-click on the package to name it (e.g.,
CustomerManagement).
4. Add Dependencies
- Click on the “Dependency” icon in the Diagram Toolbar.
- Click on the dependent package (e.g.,
OrderProcessing) and drag the arrow to the independent package (e.g.,CustomerManagement).
5. Add Import Relationships
- Click on the “Import” icon in the Diagram Toolbar.
- Click on the importing package (e.g.,
Billing) and drag the arrow to the imported package (e.g.,CustomerManagement).
6. Add Merge Relationships
- Click on the “Merge” icon in the Diagram Toolbar.
- Click on the merging package (e.g.,
CustomerManagement) and drag the arrow to the merged package (e.g.,CustomerFeedback).
7. Add Generalization Relationships
- Click on the “Generalization” icon in the Diagram Toolbar.
- Click on the specialized package (e.g.,
PremiumCustomerManagement) and drag the arrow to the general package (e.g.,CustomerManagement).
8. Save Your Diagram
- Click on “File” > “Save” to save your diagram.
Examples of Package Diagram – Software Architecture
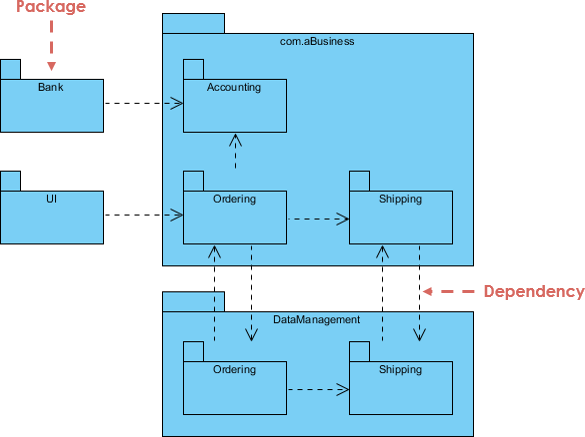
This diagram represents a software architecture or system design, illustrating the relationships and dependencies between different components or packages within a system. Here’s a detailed explanation and interpretation of the diagram:
Components and Packages
-
Packages:
- com.aBusiness: This is the main package containing several sub-packages or components.
- DataManagement: Another package that seems to handle data-related operations.
- Bank: A separate package that interacts with the
com.aBusinesspackage. - UI: A user interface package that interacts with the
com.aBusinesspackage.
-
Sub-packages/Components within
com.aBusiness:- Accounting: Handles accounting-related functionalities.
- Ordering: Manages ordering processes.
- Shipping: Deals with shipping-related operations.
-
Sub-packages/Components within
DataManagement:- Ordering: Manages data related to ordering.
- Shipping: Manages data related to shipping.
Dependencies
- Dependency Arrows:
- Solid arrows indicate direct dependencies between components.
- Dashed arrows indicate indirect or less direct dependencies.
- The red dashed arrow specifically highlights a dependency relationship between the
Orderingcomponent incom.aBusinessand theOrderingcomponent inDataManagement.
Interactions
-
Bank Package:
- The
Bankpackage interacts with theAccountingcomponent withincom.aBusiness. This suggests that accounting operations might involve financial transactions or data from the bank.
- The
-
UI Package:
- The
UIpackage interacts with theOrderingcomponent withincom.aBusiness. This indicates that user interactions related to ordering are managed through this component.
- The
-
Internal Dependencies within
com.aBusiness:- The
Orderingcomponent depends on theShippingcomponent, suggesting that ordering processes might trigger shipping operations. - The
Accountingcomponent has a dependency on theOrderingcomponent, indicating that accounting operations might rely on data or processes from ordering.
- The
-
DataManagement Package:
- The
Orderingcomponent withinDataManagementdepends on theShippingcomponent within the same package, similar to thecom.aBusinesspackage. - There is a dependency between the
Orderingcomponents ofcom.aBusinessandDataManagement, suggesting that ordering data or processes are shared or synchronized between these packages.
- The
Example Package Diagram – MIS
The diagram illustrates a structured system where different components handle specific functionalities (accounting, ordering, shipping) and interact with each other and external packages (Bank, UI). The dependencies highlight how data and processes flow between these components, ensuring that operations like ordering and shipping are coordinated and that accounting can access necessary data. The DataManagement package seems to provide a data layer that supports the operational components in com.aBusiness.

This diagram is a UML (Unified Modeling Language) package diagram that represents the architecture of a layered application. It illustrates how different components and layers interact within the system. Here’s a detailed explanation and interpretation of the diagram:
Layers of the Application
-
Presentation Layer:
- User Interface: This component handles the interaction with the users. It is responsible for displaying information to the user and capturing user inputs.
- Presentation Logic: This component manages the logic related to the presentation of data, such as formatting and user interface behavior.
-
Services Layer:
- User Interface: Similar to the presentation layer, this component interacts with external systems, providing an interface for them to communicate with the application.
- Presentation Logic: Manages the logic for presenting data to external systems.
-
Business Layer:
- Application Facade: Acts as an intermediary between the presentation layer and the business components. It simplifies interactions by providing a unified interface.
- Business Workflow: Manages the sequence of business operations and ensures that business rules are followed.
- Business Components: These are the core components that implement the business logic of the application.
- Business Entities: Represent the data structures used within the business layer to model real-world entities.
-
Data Layer:
- Data Access: This component is responsible for accessing and retrieving data from data sources.
- Service Agents: These components interact with external services to fetch or send data as needed.
-
Cross-Cutting Concerns:
- Security: Handles security-related aspects such as authentication and authorization.
- Operational Management: Manages operational tasks like logging, monitoring, and system maintenance.
- Communication: Manages communication between different components and layers of the application.
Interactions and Dependencies
- Users: Interact with the application through the presentation layer, specifically the user interface.
- External Systems: Communicate with the application through the services layer.
- Data Sources and External Services: Provide data to the application through the data layer.
The diagram depicts a well-structured, layered application architecture where each layer has specific responsibilities:
- The Presentation Layer handles user interactions and presentation logic.
- The Services Layer provides interfaces for external systems.
- The Business Layer contains the core business logic and workflows.
- The Data Layer manages data access and interactions with external services.
- Cross-Cutting Concerns like security, operational management, and communication are handled across all layers.
This architecture ensures separation of concerns, making the system modular, maintainable, and scalable.
Conclusion
Using Visual Paradigm for creating UML Package Diagrams allows you to organize and manage complex systems effectively. The ability to visualize dependencies between packages enhances understanding and communication among team members, making it easier to manage large-scale projects. By following these steps and examples, you can create clear and structured package diagrams that simplify your modeling efforts.
References
- Comprehensive Guide to UML Package Diagrams
- Visual Paradigm – Drawing Package Diagrams
- YouTube Tutorial on Package Diagrams
- YouTube Tutorial on Visual Paradigm
- Visual Paradigm – Package Diagram Tutorial
- Online Package Diagram Tutorial
- What is a Package Diagram?
- Visual Paradigm – Package Diagram Guide