Flowcharts are visual representations of processes, algorithms, or workflows. They help in understanding and communicating complex processes in a clear and concise manner. This guide will walk you through the basics of creating flowcharts using common symbols and a realistic example.
Flowchart Symbols
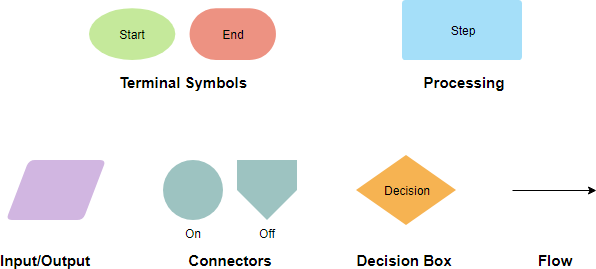
Before diving into creating a flowchart, it’s essential to understand the basic symbols used:

-
Terminal Symbols:
- Start/End: Represented by an oval or rounded rectangle. Indicates the beginning or end of a process.
-
Processing:
- Step: Represented by a rectangle. Indicates a process, action, or operation.
-
Input/Output:
- Input/Output: Represented by a parallelogram. Indicates input or output operations.
-
Connectors:
- On/Off: Represented by a circle with a label inside. Used to connect different parts of the flowchart.
-
Decision Box:
- Decision: Represented by a diamond. Indicates a decision point with two or more possible outcomes.
-
Flow:
- Flow: Represented by arrows. Indicates the direction of the flow or sequence of steps.
Creating a Flowchart
Step 1: Define the Process
Identify the process you want to represent. Break it down into smaller steps or actions.
Step 2: Use Symbols Appropriately
Use the appropriate symbols to represent each step of the process.
Step 3: Connect the Steps
Use arrows to connect the steps in the correct sequence. Ensure that the flow is logical and easy to follow.
Step 4: Add Decision Points
Identify points where decisions need to be made and use the decision box symbol. Add branches for each possible outcome.
Step 5: Review and Refine
Review the flowchart to ensure it accurately represents the process. Make any necessary adjustments.
Realistic Flowchart Example
Let’s create a flowchart for a simple process: “Order Processing System.”
Step 1: Define the Process
The order processing system involves the following steps:
- Receive Order
- Check Inventory
- Process Payment
- Ship Order
- Send Confirmation
Step 2: Use Symbols Appropriately
- Start: Oval
- Receive Order: Rectangle
- Check Inventory: Decision Box
- Process Payment: Rectangle
- Ship Order: Rectangle
- Send Confirmation: Rectangle
- End: Oval
Step 3: Connect the Steps
Use arrows to connect the steps in the correct sequence.
Step 4: Add Decision Points
Add a decision box for “Check Inventory” with branches for “In Stock” and “Out of Stock.”
Step 5: Review and Refine
Review the flowchart to ensure it accurately represents the order processing system.
Conclusion
Creating flowcharts is a powerful way to visualize and communicate processes. By understanding the basic symbols and following a structured approach, you can create clear and effective flowcharts for any process.
Reference
- Online Flowchart Tool – Visual Paradigm’s online flowchart tool is described as the easiest and most powerful in the world, allowing users to create diagrams quickly and collaboratively. It supports creating flowcharts from scratch or using templates.
- Flowchart Tutorial (with Symbols, Guide and Examples) – This tutorial provides a step-by-step guide on how to draw flowcharts using Visual Paradigm. It covers the basics of flowcharts, their symbols, and examples to help users understand and create flowcharts effectively.
- Free Online Flowchart Maker – Visual Paradigm Online offers a free flowchart maker with an intuitive drag-and-drop editor. It includes extensive built-in templates and allows users to create professional flowcharts quickly and easily.
- Flowchart Templates – This resource provides a variety of free online flowchart templates and examples. Users can sign up to create a free online workspace and start designing professional flowcharts using Visual Paradigm’s online flowchart maker.
- Flowchart Tutorial – This tutorial covers what a flowchart is, how to create one, and when to use it. It includes flowchart examples and tips, helping users learn about flowcharts and how to draw them step-by-step using Visual Paradigm.
- Easy-to-Use Flowchart Maker – Visual Paradigm is highlighted as an intuitive and powerful flowchart software, ideal for users who need a reliable and easy-to-use tool for creating visually appealing flowcharts quickly.
- Free Online Flowchart Editor – Visual Paradigm Online features a state-of-the-art online flowchart editor that allows users to create flowcharts flexibly and simply. It supports various diagram types, including mind maps, org charts, UML, ERD, and floor plans.
- Web-Based Free Flowchart Maker – This web-based flowchart maker by Visual Paradigm Online supports creating professional and beautiful flowcharts online. It offers drag-and-drop functionality, alignment tools, grouping, and formatting tools for easy diagramming.
- The Flowchart is an Online Visual Paradigm – Yonyx – This article discusses flowcharts as an online visual paradigm that promotes ideation, investigation, revision, experimentation, and deep visualization. It explores how flowcharts can be used to model processes and develop new concepts.
- Free Flowchart Tool – Visual Paradigm Online offers a free flowchart tool that allows users to create exceptional flowcharts online. It supports inserting text, external graphics, and links, making flowcharts rich in content and visually tidy.

