Introduction
In the field of system analysis and design, understanding the interactions between a system and its external environment is crucial. Context diagrams serve as a foundational tool in this process, providing a high-level overview of how a system interacts with external entities. This tutorial will delve into the concept of context diagrams, their importance, and when to use them. We’ll also explore the broader process of Data Flow Diagrams (DFDs) and the top-down decomposition technique, using a sales order system as an example.
What is a Context Diagram?
A context diagram is the highest-level representation in a Data Flow Diagram (DFD) hierarchy. It illustrates the system as a single process and shows how it interacts with external entities, such as users, other systems, or external devices. The primary purpose of a context diagram is to define the system’s boundaries and provide a broad overview of its interactions.
Key Components
- System: Represented as a single process at the center of the diagram.
- External Entities: These are the users or other systems that interact with the main system.
- Data Flows: Arrows that depict the flow of data between the system and external entities.
- Process: The central process represents the entire system being modeled.
Why Use a Context Diagram?
Context diagrams are essential for several reasons:
- Clarity: They provide a clear and concise overview of the system’s interactions with its environment.
- Scope Definition: They help define the scope and boundaries of the system, ensuring that all stakeholders have a common understanding.
- Communication: They serve as a communication tool between developers, analysts, and stakeholders, facilitating discussions about system requirements and design.
- Foundation: They lay the groundwork for more detailed DFDs by establishing the system’s context.
When to Use a Context Diagram
Context diagrams are typically used at the beginning of the system analysis and design process. They are particularly useful in the following scenarios:
- Initial System Analysis: When starting a new project, a context diagram helps establish the system’s boundaries and interactions.
- Stakeholder Communication: When communicating with stakeholders to ensure everyone has a shared understanding of the system’s scope.
- Requirements Gathering: During the requirements gathering phase to identify external entities and their interactions with the system.
Example: Sales Order System
Let’s use the example of a sales order system to illustrate the concept and process of creating a context diagram and applying the top-down decomposition technique.
Context Diagram for Sales Order System
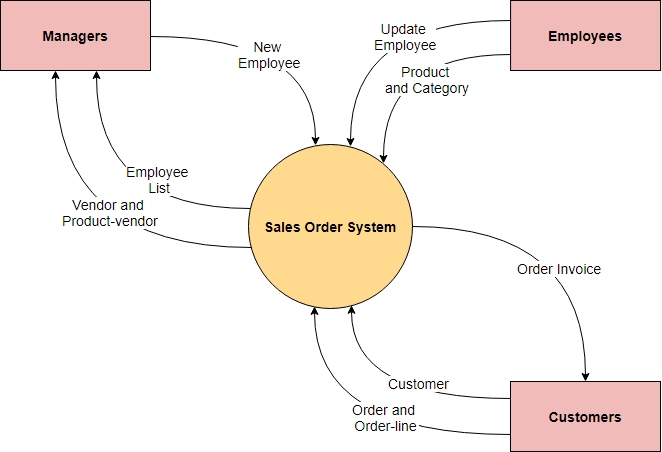
In the provided image, the context diagram for a sales order system shows the following:
- Central Process: The “Sales Order System” is the main process.
- External Entities: Managers, Employees, and Customers.
- Data Flows:
- Managers provide “Employee List” and “Vendor and Product-vendor” information.
- Employees interact with the system to “Update Employee” details and manage “Product and Category.”
- Customers receive “Order Invoice” and interact with the system for “Order and Order-line.”
Process of Top-Down Decomposition
-
Identify the System: Start by identifying the main system you want to model—in this case, the Sales Order System.
-
Identify External Entities: Determine the external entities that interact with the system, such as Managers, Employees, and Customers.
-
Define Data Flows: Identify the data flows between the system and external entities. For example, Managers provide employee and vendor information, while Customers receive order invoices.
-
Create the Context Diagram: Draw the context diagram with the system at the center and connect it to the external entities with data flows.
-
Decompose Further: If needed, decompose the system into more detailed DFDs to capture specific processes and data flows within the system.
Conclusion
Context diagrams are invaluable tools in the system analysis and design process, providing a clear and concise overview of a system’s interactions with its environment. By using context diagrams and the top-down decomposition technique, you can effectively model complex systems, ensuring clarity, scope definition, and stakeholder communication. The example of the sales order system demonstrates how context diagrams can be used to establish the foundation for more detailed analysis and design efforts. Whether you are a system analyst, developer, or stakeholder, understanding and utilizing context diagrams will enhance your ability to design and implement robust systems.
DFD References
-
Visual Paradigm Data Flow Diagrams – Stack Overflow
- Discusses the availability of Data Flow Diagrams in different editions of Visual Paradigm, including the need for the Modeler Edition or higher to create DFDs.
- Read more on Stack Overflow
-
Online Data Flow Diagram Maker
- An online tool for creating Data Flow Diagrams quickly and efficiently, with features for sharing diagrams in various formats.
- Explore the Online DFD Maker
-
A Step-by-Step Guide to Creating Data Flow Diagrams with Visual Paradigm
- Provides a detailed guide on creating DFDs using Visual Paradigm, including drag-and-drop functionality for external entities and processes.
- Access the Step-by-Step Guide
-
Data Flow Diagram Tool – Visual Paradigm
- Highlights the features of Visual Paradigm’s DFD tool, including the ability to decompose processes and maintain model integrity across different levels.
- Learn about the DFD Tool
-
What is Data Flow Diagram?
- Explains the structure and purpose of DFDs, emphasizing their role in visualizing data flow within a system.
- Understand Data Flow Diagrams
-
Data flow diagram in Visual Paradigm
- Offers a chapter on creating DFDs with Visual Paradigm, including supported notations and process decomposition techniques.
- Read the Data Flow Diagram Chapter
-
How to Draw Data Flow Diagram (DFD)?
- Provides instructions on drawing DFDs, including how to decompose processes and manage data flows between different levels.
- Learn How to Draw DFDs 7
-
Mastering Data Flow Diagrams with Visual Paradigm: A Step-by-Step Guide
- A comprehensive guide on mastering DFDs using Visual Paradigm, with practical examples and templates.
- Access the Mastering DFD Guide
-
Data Flow Diagram Templates
- Offers free online DFD templates and examples to help users create professional diagrams.
- Explore DFD Templates
-
How to Create Data Flow Diagram (DFD)?
- A tutorial on creating DFDs, including steps for selecting templates and adding details to diagrams.
- Follow the DFD Creation Tutorial
These references provide a solid foundation for understanding and creating Data Flow Diagrams using Visual Paradigm, with resources ranging from basic guides to advanced tutorials.