


Introduction
In the realm of system analysis and design, understanding how data flows through a system is crucial for ensuring efficiency, reliability, and security. Data Flow Diagrams (DFDs) serve as a visual tool to map out these data flows, providing a clear representation of how information is processed and stored within a system. The top-down decomposition technique is a systematic approach to creating DFDs, allowing analysts to break down complex systems into manageable components. This tutorial will guide you through the key concepts of DFDs, the process of top-down decomposition, and practical tips for creating effective diagrams. By the end, you’ll be equipped with the knowledge to model systems accurately and gain insights into their data processing mechanisms.
Key Concepts
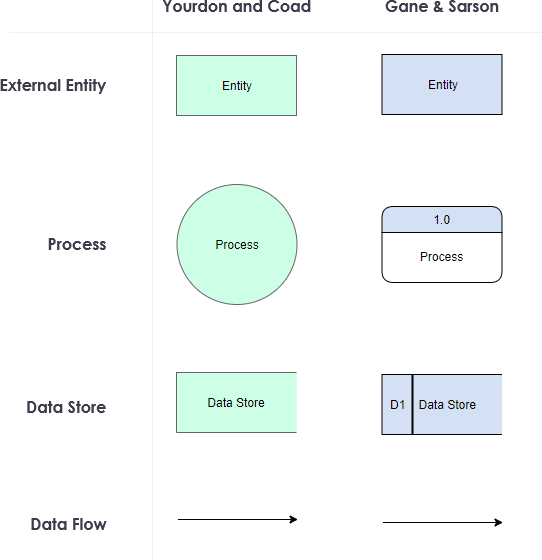
1. Entities
Entities are external systems, individuals, or devices that interact with the system being modeled. They serve as sources or destinations of data.
2. Processes
Processes are activities or operations that transform data within the system. They take inputs, process them, and produce outputs.
3. Data Stores
Data stores are repositories where data is held for future use. They can be databases, files, or any other form of storage.
4. Data Flows
Data flows represent the movement of data between entities, processes, and data stores. They are depicted as arrows connecting these components.
5. Context Diagram
The context diagram is the highest-level DFD that provides a broad overview of the system and its interactions with external entities.
6. Levels of Decomposition
DFDs are typically decomposed into multiple levels, with each level providing more detailed information about the processes in the level above.
Top-Down Decomposition Technique
The top-down decomposition technique involves starting with a high-level view of the system (context diagram) and progressively breaking it down into more detailed levels. Each level provides a more granular view of the processes and data flows within the system.
 Using Top-Down Decomposition Technique")
Step-by-Step Guide
-
Create the Context Diagram (Level 0)
- Identify the main system and its interactions with external entities.
- Draw the system as a single process and connect it to the entities with data flows.
- Example: In the image, the context diagram shows the system interacting with three entities.
-
Decompose to Level 1
- Break down the main system into its major sub-processes.
- Identify the data stores and data flows between the sub-processes and entities.
- Example: In the image, Level 1 decomposes the system into Process 1, Process 2, and Process 3, each interacting with entities and data stores.
-
Decompose Further (Level 2 and Beyond)
- Continue decomposing each sub-process into more detailed processes until the desired level of granularity is achieved.
- Ensure that each process at a lower level is a more detailed representation of a process at the higher level.
- Example: In the image, Process 2 is further decomposed into Process 2.1 and Process 2.2, each with its own data flows and interactions.
Tips and Tricks
- Start Simple: Begin with a simple context diagram and gradually add details as you decompose the system.
- Consistency: Ensure that the data flows and processes are consistent across different levels of decomposition.
- Iterative Refinement: Iteratively refine the DFDs based on feedback and additional information.
- Use Standard Symbols: Use standard symbols for entities, processes, data stores, and data flows to maintain clarity and consistency.
- Document Assumptions: Clearly document any assumptions made during the creation of the DFDs to avoid misunderstandings.
Guidelines
- Clarity and Simplicity: Aim for clarity and simplicity in your diagrams. Avoid overcomplicating the DFDs.
- Validation: Validate the DFDs with stakeholders to ensure they accurately represent the system.
- Modularity: Ensure that each process is modular and can be understood independently of others.
- Traceability: Maintain traceability between different levels of decomposition to facilitate easy navigation and understanding.
Conclusion
Data Flow Diagrams, when constructed using the top-down decomposition technique, offer a structured and comprehensive way to understand and analyze the data flows within a system. By starting with a high-level context diagram and progressively decomposing it into detailed levels, you can capture the intricacies of data processing and storage. Following the guidelines and tips provided in this tutorial will help you create clear, consistent, and effective DFDs. Whether you are a system analyst, a software developer, or a business stakeholder, mastering DFDs will enhance your ability to design robust systems and ensure that data flows are optimized for performance and security. Embrace the power of DFDs to unlock deeper insights into your systems and drive informed decision-making.
DFD References
-
Visual Paradigm Data Flow Diagrams – Stack Overflow
- Discusses the availability of Data Flow Diagrams in different editions of Visual Paradigm, including the need for the Modeler Edition or higher to create DFDs.
- Read more on Stack Overflow
-
Online Data Flow Diagram Maker
- An online tool for creating Data Flow Diagrams quickly and efficiently, with features for sharing diagrams in various formats.
- Explore the Online DFD Maker
-
A Step-by-Step Guide to Creating Data Flow Diagrams with Visual Paradigm
- Provides a detailed guide on creating DFDs using Visual Paradigm, including drag-and-drop functionality for external entities and processes.
- Access the Step-by-Step Guide
-
Data Flow Diagram Tool – Visual Paradigm
- Highlights the features of Visual Paradigm’s DFD tool, including the ability to decompose processes and maintain model integrity across different levels.
- Learn about the DFD Tool
-
What is Data Flow Diagram?
- Explains the structure and purpose of DFDs, emphasizing their role in visualizing data flow within a system.
- Understand Data Flow Diagrams
-
Data flow diagram in Visual Paradigm
- Offers a chapter on creating DFDs with Visual Paradigm, including supported notations and process decomposition techniques.
- Read the Data Flow Diagram Chapter
-
How to Draw Data Flow Diagram (DFD)?
- Provides instructions on drawing DFDs, including how to decompose processes and manage data flows between different levels.
- Learn How to Draw DFDs 7
-
Mastering Data Flow Diagrams with Visual Paradigm: A Step-by-Step Guide
- A comprehensive guide on mastering DFDs using Visual Paradigm, with practical examples and templates.
- Access the Mastering DFD Guide
-
Data Flow Diagram Templates
- Offers free online DFD templates and examples to help users create professional diagrams.
- Explore DFD Templates
-
How to Create Data Flow Diagram (DFD)?
- A tutorial on creating DFDs, including steps for selecting templates and adding details to diagrams.
- Follow the DFD Creation Tutorial
These references provide a solid foundation for understanding and creating Data Flow Diagrams using Visual Paradigm, with resources ranging from basic guides to advanced tutorials.